Top 10 Oil Producing Countries: The Buyers, the Barrels, and the Countdown Clock
The global economy runs on oil the way a carnival band runs on rum and riddim. When the supply stops flowing, everything from airline tickets to grocery shelves begins to wobble.
Right now that wobble is real. The conflict in the Middle East and the effective paralysis of tanker traffic through the Strait of Hormuz has reminded the world of a simple truth: a handful of countries control the energy heartbeat of the planet.
But here’s the twist. The top 10 oil producing countries are not all built the same.
Some produce massive amounts but burn most of it themselves. Others export nearly everything they pump. And a few are sitting on reserves that could last generations, while others are burning through their underground savings account at remarkable speed.
When you put the numbers together, you begin to see a geopolitical leaderboard hiding behind the oil market.
Who pumps the most.
Who sells the most.
And who might run out sooner than people think.
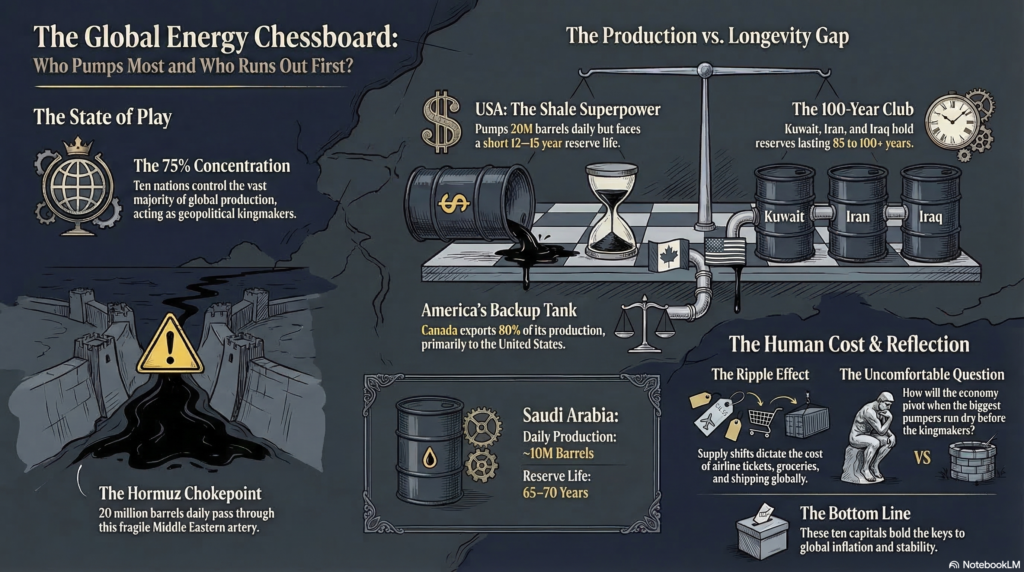
The World’s Top 10 Oil Producing Countries
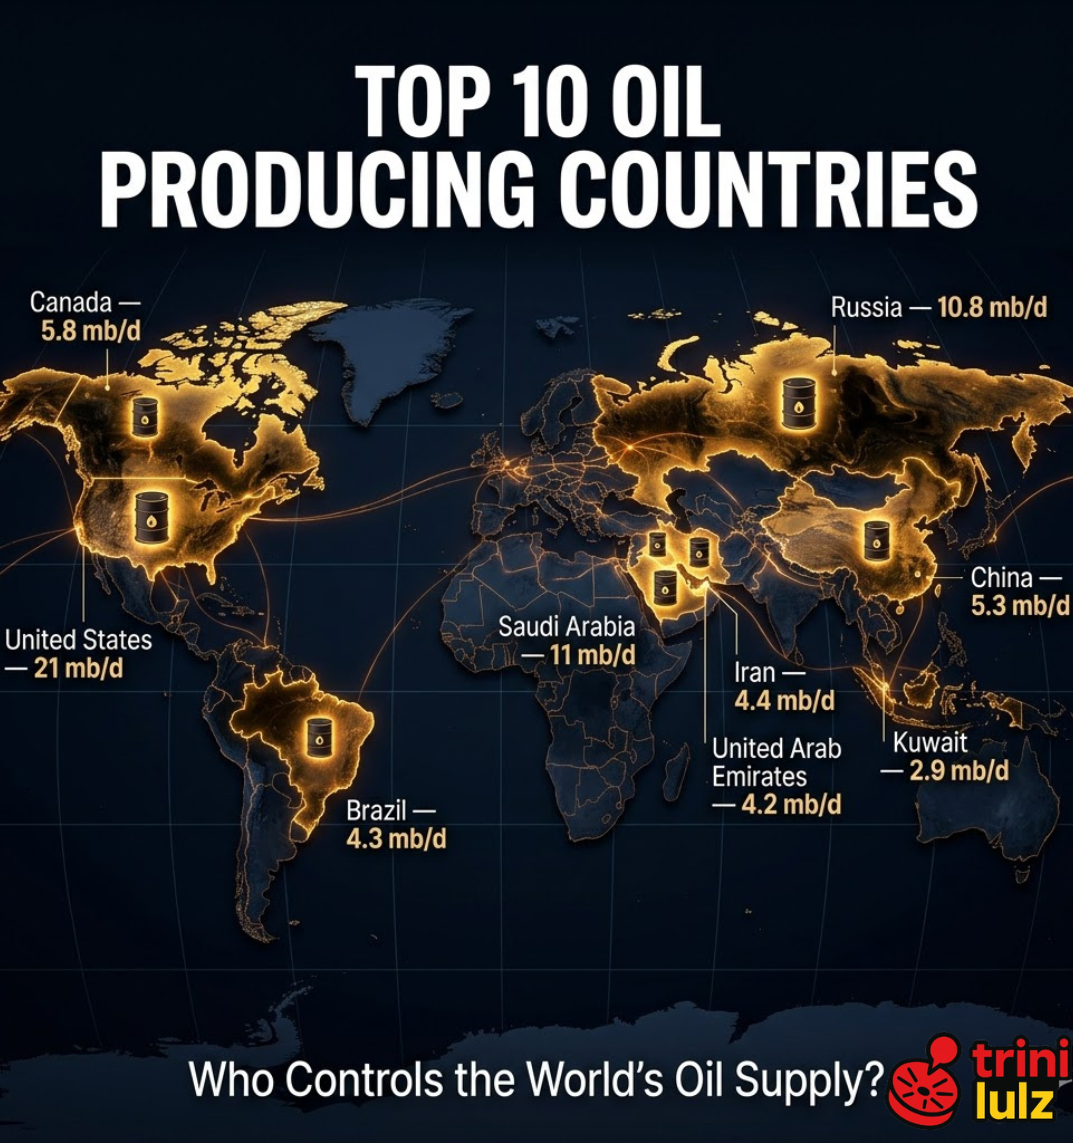
Together, the top 10 oil producing countries account for roughly 70–75% of global oil production, according to widely cited global oil production rankings compiled by the U.S. Energy Information Administration.
Here’s the current global leaderboard by production:
Global Oil Power Table: Buyers, Barrels, and the Countdown Clock
| Rank | Country | Production (mb/d) | Export Share of Production | Proven Oil Reserves (Billion Barrels) | Estimated Years Remaining at Current Production |
|---|---|---|---|---|---|
| 1 | United States | ~21.9 | ~20% | ~84 | ~11 years |
| 2 | Saudi Arabia | ~11.1 | ~70% | ~267 | ~66 years |
| 3 | Russia | ~10.8 | ~50% | ~80 | ~20 years |
| 4 | Canada | ~5.8 | ~80% | ~163 | ~77 years |
| 5 | China | ~5.3 | ~5% | ~28 | ~14 years |
| 6 | Iraq | ~4.4 | ~85% | ~145 | ~90 years |
| 7 | Brazil | ~4.3 | ~40% | ~16 | ~11 years |
| 8 | United Arab Emirates | ~4.2 | ~65% | ~113 | ~70 years |
| 9 | Iran | ~4.0 | ~60%* | ~209 | ~140 years |
| 10 | Kuwait | ~2.9 | ~90% | ~102 | ~96 years |
*Iran export levels fluctuate significantly due to sanctions and shadow shipping networks.
Each of these countries plays a very different role in the global energy chessboard.
1. United States – The Shale Superpower
Production: ~20–21 million barrels per day (petroleum liquids)
Export share: ~20–25% of production
Estimated reserves: ~47 billion barrels
Approximate reserve life at current production: ~12–15 years
The United States is the undisputed heavyweight champion of oil production thanks to the shale revolution. Hydraulic fracturing turned Texas and North Dakota into the world’s most productive oil regions.
But America also consumes enormous amounts of energy. Much of its production feeds its own economy.
Major buyers of U.S. crude exports include:
- Netherlands
- Mexico
- Canada
- South Korea
- India
Quote-worthy insight
“America pumps the most oil in the world — but it also burns most of it at home.”
2. Saudi Arabia – The Swing Producer
Production: ~10–11 million barrels per day
Export share: ~70–75%
Estimated reserves: ~267 billion barrels
Reserve life: ~65–70 years
Saudi Arabia sits on one of the largest oil treasure chests on Earth. Its national oil company, Saudi Aramco, is effectively the engine powering the kingdom’s economy.
Its biggest buyers:
- China
- Japan
- South Korea
- India
Saudi Arabia is also the world’s “swing producer.” That means it can raise or lower output to influence global prices.
3. Russia – The Redirected Giant
Production: ~10–11 million barrels per day
Export share: ~50%
Estimated reserves: ~108 billion barrels
Reserve life: ~25–30 years
Western sanctions after the Ukraine war forced Russia to reroute much of its oil trade.
Instead of Europe, Russian oil now flows heavily toward:
- China
- India
- Turkey
The Kremlin has essentially rebuilt its export network around Asia.
4. Canada – America’s Oil Tank
Production: ~5.7–6 million barrels per day
Export share: ~80%
Estimated reserves: ~168 billion barrels
Reserve life: ~80+ years
Canada’s oil sands contain one of the largest proven reserves on Earth.
But geography shapes its trade: over 90% of Canadian oil exports go to the United States.
Canada is essentially America’s backup fuel tank.
5. China – The Giant That Still Imports
Production: ~4–5 million barrels per day
Export share: minimal
Estimated reserves: ~26 billion barrels
Reserve life: ~15 years
China produces a lot of oil but consumes far more than it pumps.
As a result, it is the world’s largest oil importer.
Major suppliers include:
- Saudi Arabia
- Russia
- Iraq
- Brazil
China’s energy strategy is less about production and more about securing supply lines.
6. Iraq – The Export Machine
Production: ~4.5 million barrels per day
Export share: ~85–90%
Estimated reserves: ~145 billion barrels
Reserve life: ~85–90 years
Iraq produces enormous volumes of oil relative to its population.
Most of it flows abroad, especially to:
- China
- India
- South Korea
For Iraq, oil exports fund the overwhelming majority of government revenue.
7. Brazil – The Rising Atlantic Power
Production: ~4.2 million barrels per day
Export share: ~40–50%
Estimated reserves: ~15 billion barrels
Reserve life: ~10–15 years
Brazil’s offshore pre-salt fields transformed the country into a major oil exporter.
Its main buyers include:
- China
- United States
- Spain
Brazil is one of the fastest-growing producers in the Western Hemisphere.
8. United Arab Emirates – The Quiet Energy Giant
Production: ~3.6–4 million barrels per day
Export share: ~65–70%
Estimated reserves: ~111 billion barrels
Reserve life: ~70–80 years
The UAE’s oil wealth helped build cities like Abu Dhabi and Dubai into global financial hubs.
Key buyers:
- Japan
- China
- Thailand
- India
9. Iran – The Sanctions Black Box
Production: ~3.5–4 million barrels per day
Export share: difficult to track due to sanctions
Estimated reserves: ~157 billion barrels
Reserve life: ~90+ years
Iran’s oil industry operates under heavy sanctions, meaning much of its export trade happens quietly through shadow shipping networks.
China is widely believed to be the largest buyer of Iranian crude.
10. Kuwait – The Small Giant
Production: ~2.5–3 million barrels per day
Export share: ~90%
Estimated reserves: ~101 billion barrels
Reserve life: ~100+ years
Despite its small population, Kuwait remains one of the most oil-rich countries on Earth.
Major buyers:
- China
- South Korea
- Japan
- India
The Countdown Clock: Who Has Oil for the Long Haul?
If current production levels stayed constant, the reserve life picture looks roughly like this, based on estimates of global proven oil reserves and current production rates.
Long lifespan producers:
- Kuwait
- Iran
- Iraq
- Canada
- Saudi Arabia
(70–100+ years)
Medium horizon:
- Russia
- UAE
(25–70 years)
Shorter horizon:
- United States
- China
- Brazil
(10–20 years)
Of course, new discoveries, technology, and changing demand could alter these timelines dramatically.
But the countdown clock remains one of the most revealing metrics in the energy world.
Why the Oil Map Matters Right Now
The current Middle East crisis has revealed just how fragile the global energy system remains.
Roughly 20 million barrels per day normally pass through the Strait of Hormuz, making it the most important oil chokepoint on Earth.
When that flow falters, markets panic.
The world’s top oil producers suddenly become more than just economic players — they become geopolitical kingmakers.
Call-out quote for social media
“The global economy runs on oil — and ten countries hold the keys to the pump.”
What It Means for Trinidad and the Caribbean
For small energy producers like Trinidad and Tobago, these global shifts matter enormously.
Higher oil prices can boost government revenues for energy exporters.
But they also increase fuel, food, and shipping costs across the Caribbean.
In other words, when the oil giants move, the ripple effects reach every island.
The Bottom Line
The top 10 oil producing countries are more than just energy suppliers. They are the structural pillars of the global economy.
Their production decisions influence everything from inflation to airline tickets.
And as the current crisis shows, when the world’s oil arteries get squeezed, everyone feels the pressure.
The only real question is how long those underground reservoirs — and the political stability around them — will hold.